
The Problem and the Design
Most Fundamental analysis is tedious. You have to go into the company's data. You have to look at their annual reports, their quarterly earnings transcripts, their presentations released periodically. For any one company, this would usually amount to anywhere between 500 and 1,000 pages a year. Any investor individually would hold between 20 and 30 stocks in their portfolio. That's between 10,000 and 30,000 pages of reading materials.
Now, while that might sound like a lot, and it is, for anyone who is willing to spend that time to absorb this information, will most definitely have an edge in terms of portfolio performance. Unfortunately, we live in a time of diminishing attention spans. The question remains: how do we distill information in such a way that we are capturing the synthesis of any asset that we are exploring an investment in?
This is where QuantCase's MOD framework comes into play. The methodology is simple—can we take all of this information, and condense it into answering just three core questions:
- 1.How good is the company’s management?Do they disclose bad news in time? How is their guidance credibility? Is the promoter acting in good faith? Is the management good at allocating their resources?
- 2.Is it an attractive opportunity?Is the industry growing? How's the competitive intensity? How's the financial strength of the business? Has the company built durable distribution?
- 3.Is it a good deal?Is the quality of their revenue improving or deteriorating? Are their earnings expected to grow or stay stagnant?
The team behind QuantCase has been investing in global markets, both on the private and public equity side, for over a decade. What we've learnt from being an investor for that long is that there is no end to analysis. Fortunately, we live in a time where information and data are abundant. At the same time, actionable insight is something which is getting lost in the sea of content and information.
What people miss about companies is that they are living, breathing organisms made up of hundreds and often thousands of employees who contribute to a singular mission. The interactions between different stakeholders of a company, be it the customers, the competition, the suppliers, the investors, all of those interactions create a broad range and depth of signals. But they also generate a lot more noise. What QuantCase excels at is interpreting those signals. Be it signals arising during analyst questioning or emerging in annual reports or simply in activity of the promoter group.
QuantCase extracts signals per company from transcripts, annual reports and decks. We detect and interpret patterns across those signals, routing them into our lens architecture - MANAGEMENT - OPPORTUNITY - DEAL.
Below are real analyses of HDFC Bank and Reliance. One data point is noise. The same pattern holding across peers, across quarters, or across a metric’s own path over time is signal — that’s what the examples below are built to catch.
HDFC Bank
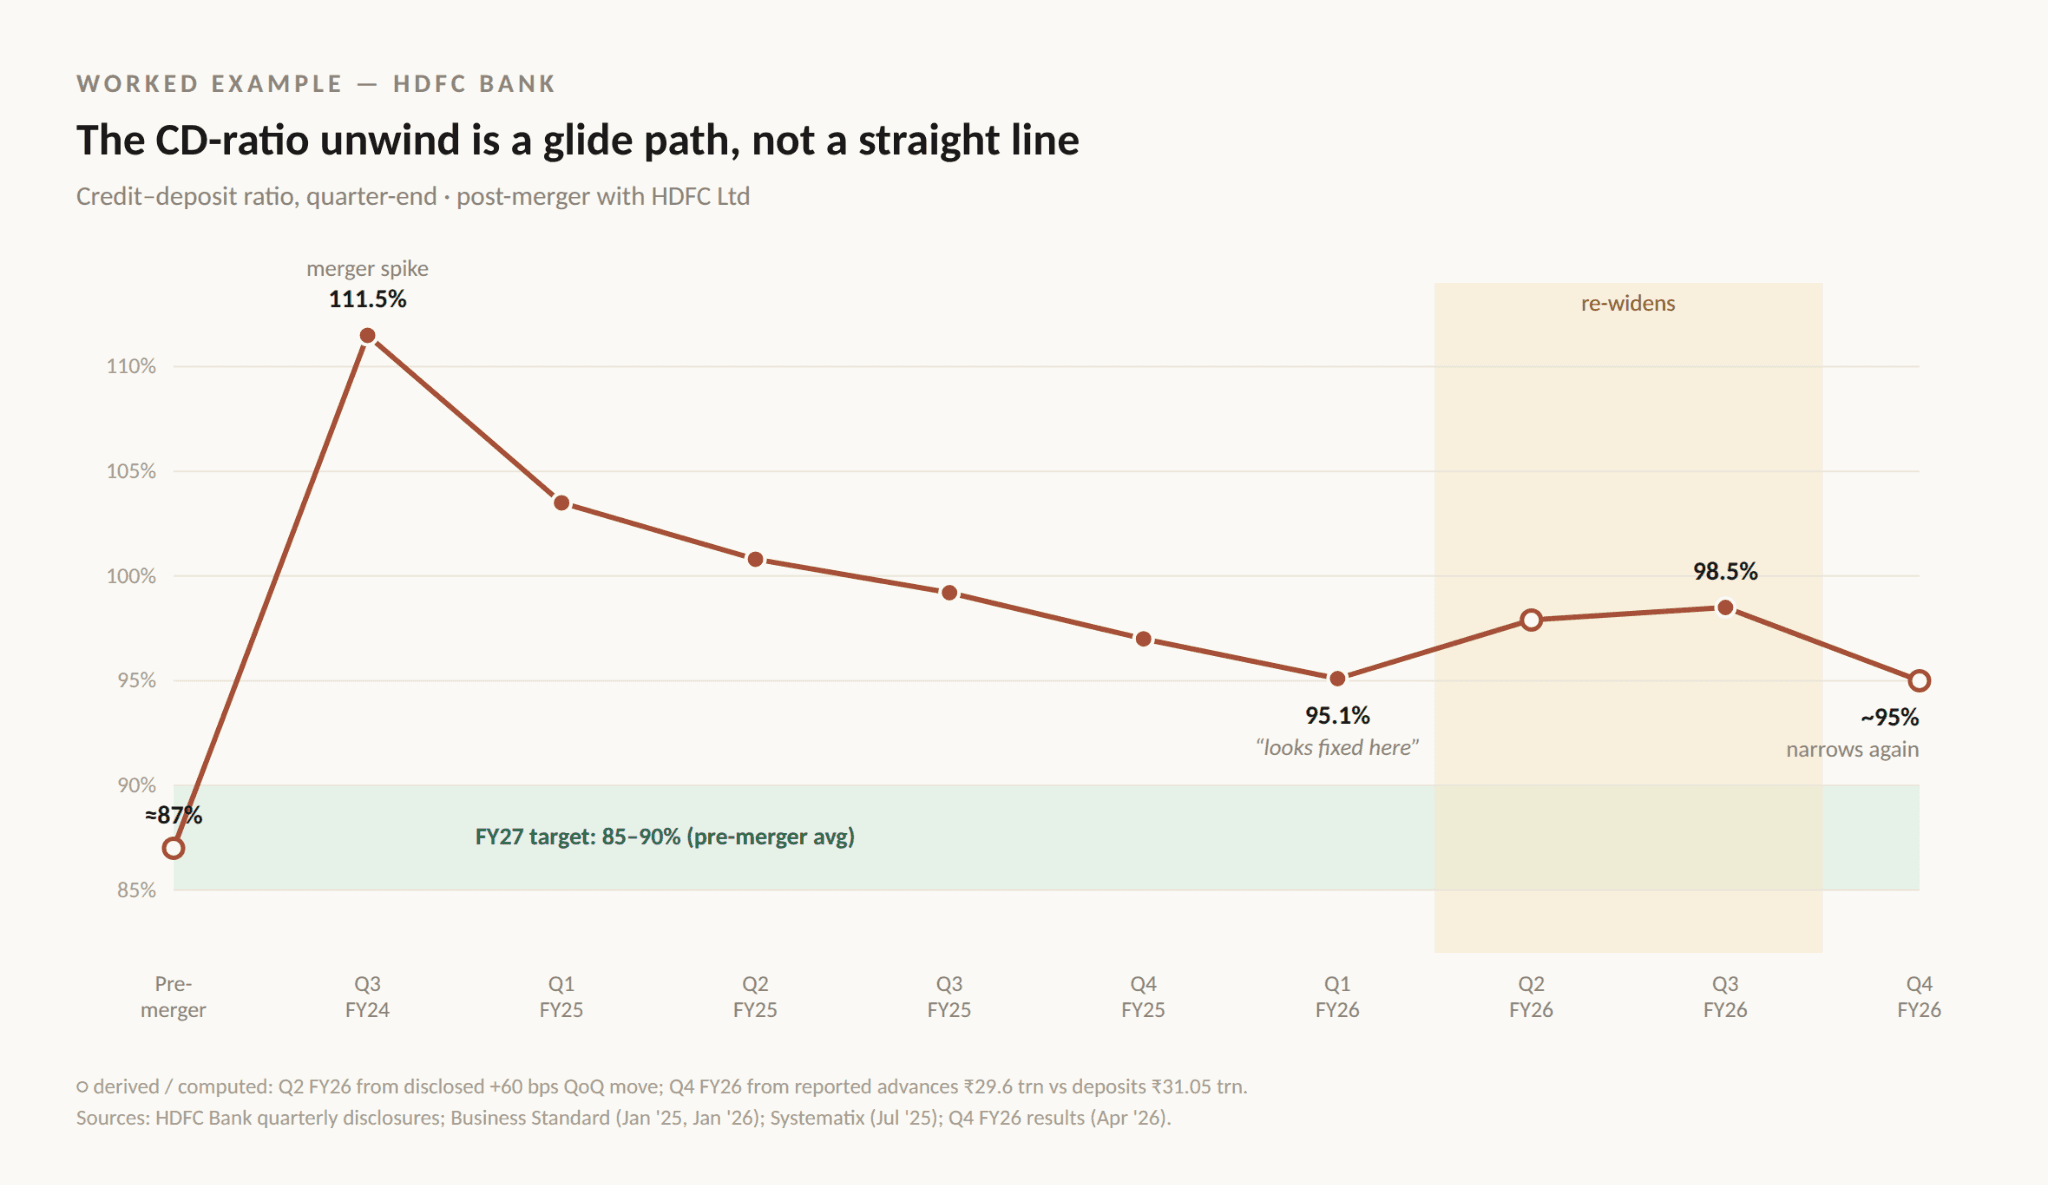
The story everyone knows: the merger brought a giant loan book and not enough deposits, the CD ratio spiked to 111.5%, and the bank has been walking it down since. A before/after read says fixed — 95% by June 2025.
The quarter-by-quarter path says otherwise. The ratio re-widened to 98.5% by Q3 FY26 as loans outran deposits again, then deposits caught up and pulled it back to ~95% by March 2026. Management still wants the pre-merger 85–90% by FY27. So we interpret that the overhang is shrinking — but on a glide path, not a straight line.
The aha: resolution is a path, not a switch. A stale snapshot says the de-risking is done; the path says it isn't. And every quarter spent above 85–90% is a quarter of costlier funding — which hits margin before it ever hits guidance.
Reliance
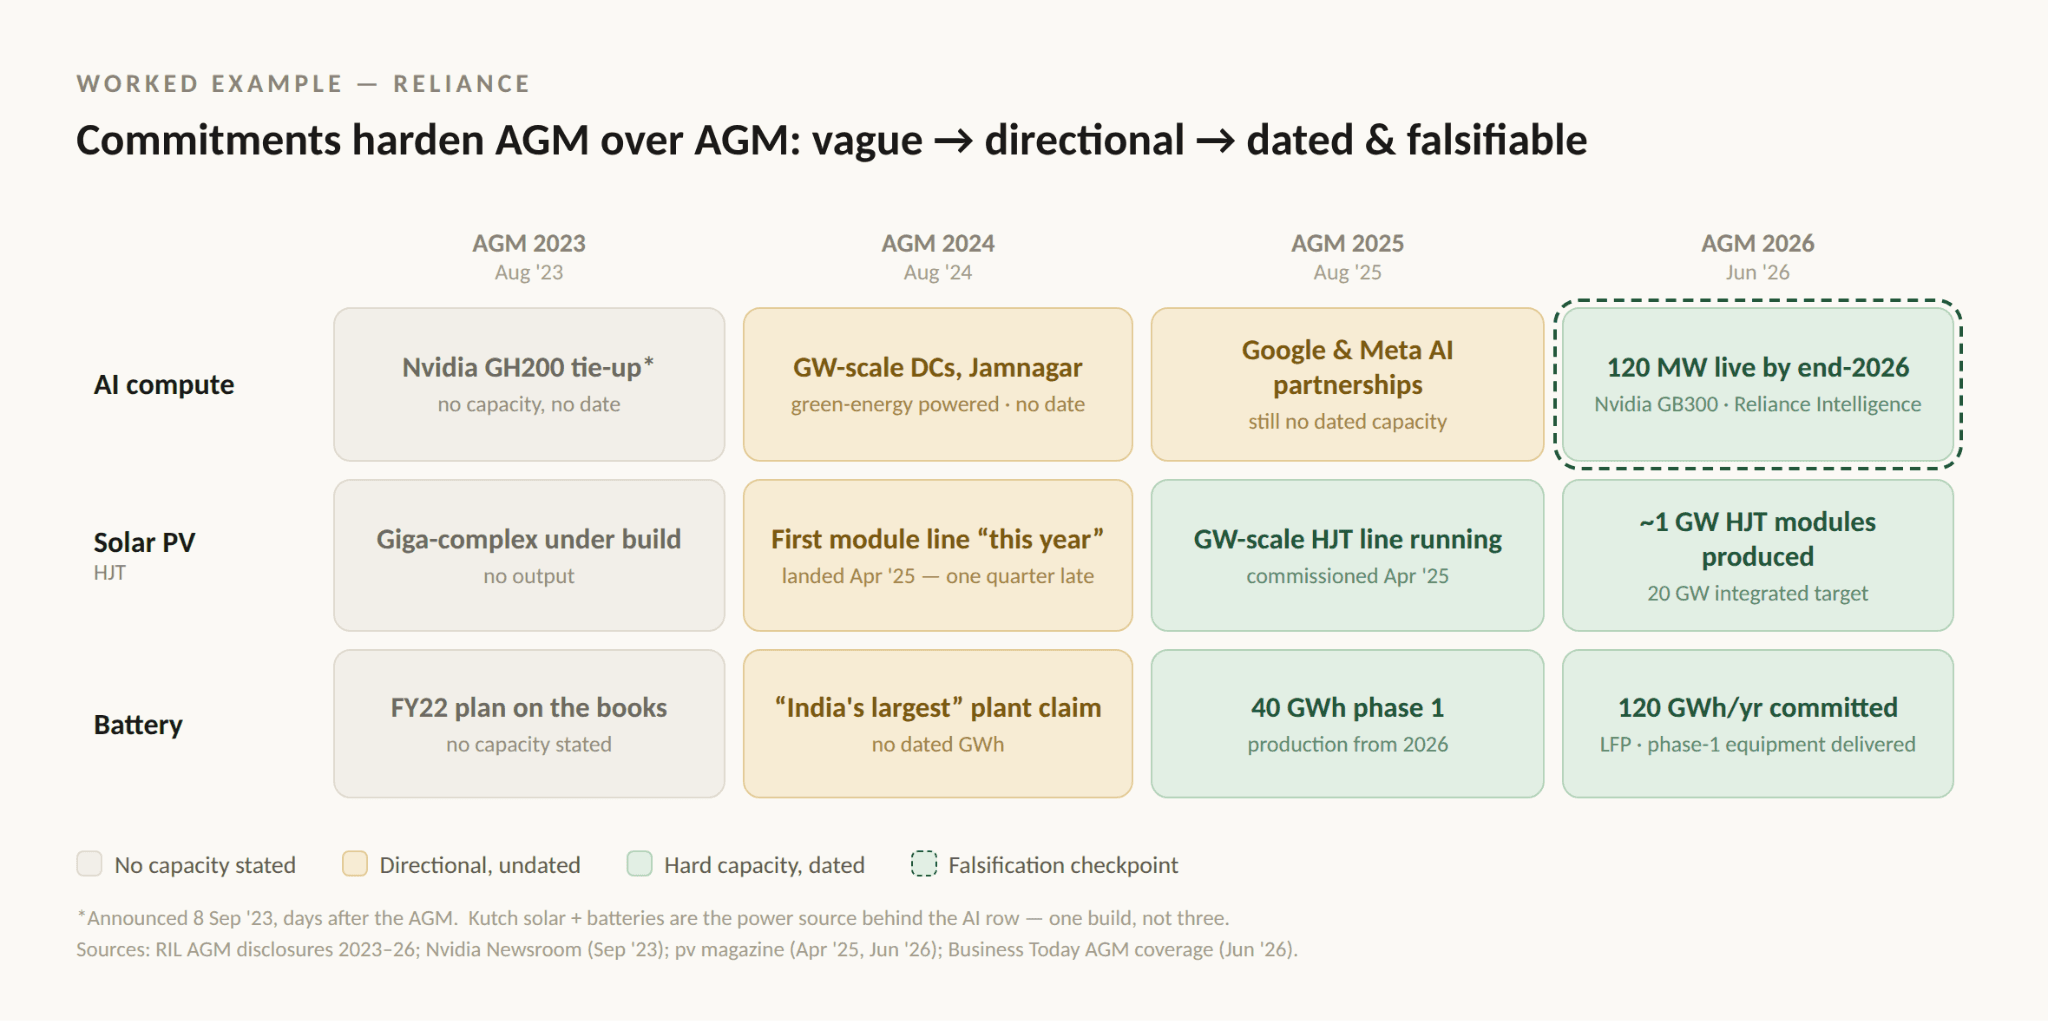
Everyone parses Reliance's quarterly calls. Wrong document. Reliance commits once a year, at the AGM - the calls just report against what was already set there. So we read the AGMs, and watch each bet harden.
- The AI bet: 2023, a partnership with Nvidia — no capacity, no date.
- 2024, "gigawatt-scale AI data centres in Jamnagar" — a plan, still no date.
- 2026: 120 MW live by end-2026, on Nvidia GB300s. Vague → directional → dated.
Solar and batteries walk the same ladder — a module line under build becomes ~1 GW of HJT modules actually produced; an old FY22 plan becomes 40 GWh starting this year, committed to 120.
And these aren't three bets. It’s a pattern formation, indicating a bigger objective in the making. The solar and battery rows exist to make Jamnagar's compute cheap - a solar yield gain is an AI margin event.
The aha: you're no longer debating a narrative. You have a date. If 120 MW isn't live by end-2026, the AI thesis cracks — quarters before it would ever show up in the P&L.
Pattern recognition is the nuance between analysis and interpretation. Its what sets us apart.
We call it QuantCase Intuition.